3. Evaluation Metrics
By Bernd Klein. Last modified: 17 Feb 2022.
Introduction
Not only in machine learning but also in general life, especially business life, you will hear questions like "How accurate is your product?" or "How precise is your machine?". When people get replies like "This is the most accurate product in its field!" or "This machine has the highest imaginable precision!", they feel fomforted by both answers. Shouldn't they? Indeed, the terms accurate and precise are very often used interchangeably. We will give exact definitions later in the text, but in a nutshell, we can say: Accuracy is a measure for the closeness of some measurements to a specific value, while precision is the closeness of the measurements to each other.

These terms are also of extreme importance in Machine Learning. We need them for evaluating ML algorithms or better their results.
We will present in this chapter of our Python Machine Learning Tutorial four important metrics. These metrics are used to evaluate the results of classifications. The metrics are:
- Accuracy
- Precision
- Recall
- F1-Score
We will introduce each of these metrics and we will discuss the pro and cons of each of them. Each metric measures something different about a classifiers performance. The metrics will be of outmost importance for all the chapters of our machine learning tutorial.
Live Python training

Enjoying this page? We offer live Python training courses covering the content of this site.
See our Python training courses
Accuracy
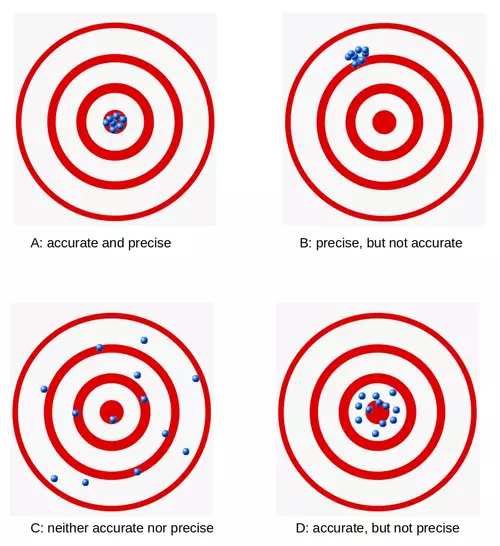
Accuracy is a measure for the closeness of the measurements to a specific value, while precision is the closeness of the measurements to each other, i.e. not necessarily to a specific value. To put it in other words: If we have a set of data points from repeated measurements of the same quantity, the set is said to be accurate if their average is close to the true value of the quantity being measured. On the other hand, we call the set to be precise, if the values are close to each other. The two concepts are independent of each other, which means that the set of data can be accurate, or precise, or both, or neither. We show this in the following diagram:
Confusion Matrix
Before we continue with the term accuracy, we want to make sure that you understand what a confusion matrix is about.
A confusion matrix, also called a contingency table or error matrix, is used to visualize the performance of a classifier.
The columns of the matrix represent the instances of the predicted classes and the rows represent the instances of the actual class. (Note: It can be the other way around as well.)
In the case of binary classification the table has 2 rows and 2 columns.
We want to demonstrate the concept with an example.
Confusion Matrix Example
| Predicted classes | |||
|---|---|---|---|
| cat | dog | ||
| Actual classes |
cat | 42 | 8 |
| dog | 18 | 32 | |
This means that the classifier correctly predicted a cat in 42 cases and it wrongly predicted 8 cat instances as dog. It correctly predicted 32 instances as dog. 18 cases had been wrongly predicted as cat instead of dog.
Live Python training
Enjoying this page? We offer live Python training courses covering the content of this site.
Upcoming online Courses
See our Python training courses
Accuracy in Classification
We are interested in Machine Learning and accuracy is also used as a statistical measure. Accuracy is a statistical measure which is defined as the quotient of correct predictions (both True positives (TP) and True negatives (TN)) made by a classifier divided by the sum of all predictions made by the classifier, including False positves (FP) and False negatives (FN). Therefore, the formula for quantifying binary accuracy is:
$$ \text{accuracy} = {{TP + TN} \over {TP + TN + FP + FN}} $$
where: TP = True positive; FP = False positive; TN = True negative; FN = False negative
The corresponding Confusion Matrix looks like this:
| Predicted classes | |||
|---|---|---|---|
| negative | positive | ||
| Actual classes |
negative | TN | FP |
| positive | FN | TP | |
We will now calculate the accuracy for the cat-and-dog classification results. Instead of "True" and "False", we see here "cat" and "dog". We can calculate the accuracy like this:
TP = 42
TN = 32
FP = 8
FN = 18

Accuracy = (TP + TN)/(TP + TN + FP + FN)
print(Accuracy)
OUTPUT:
0.74
Let's assume we have a classifier, which always predicts "dog".
| Predicted classes | |||
|---|---|---|---|
| cat | dog | ||
| Actual classes |
cat | 0 | 50 |
| dog | 0 | 50 | |
We have an accuracy of 0.5 in this case:
TP, TN, FP, FN = 0, 50, 50, 0
Accuracy = (TP + TN)/(TP + TN + FP + FN)
print(Accuracy)
OUTPUT:
0.5
Accuracy Paradox
We will demonstrate the so-called accuracy paradox.
A spam recogition classifier is described by the following confusion matrix:
| Predicted classes | |||
|---|---|---|---|
| spam | ham | ||
| Actual classes |
spam | 4 | 1 |
| ham | 4 | 91 | |
TP, TN, FP, FN = 4, 91, 1, 4
accuracy = (TP + TN)/(TP + TN + FP + FN)
print(accuracy)
OUTPUT:
0.95
The following classifier predicts solely "ham" and has the same accuracy.
| Predicted classes | |||
|---|---|---|---|
| spam | ham | ||
| Actual classes |
spam | 0 | 5 |
| ham | 0 | 95 | |
TP, TN, FP, FN = 0, 95, 5, 0
accuracy = (TP + TN)/(TP + TN + FP + FN)
print(accuracy)
OUTPUT:
0.95
The accuracy of this classifier is 95%, even though it is not capable of recognizing any spam at all.
Live Python training
Enjoying this page? We offer live Python training courses covering the content of this site.
See our Python training courses
Precision
Precision is the ratio of the correctly identified positive cases to all the predicted positive cases, i.e. the correctly and the incorrectly cases predicted as positive. Precision is the fraction of retrieved documents that are relevant to the query. The formula:
$$ precision = {TP \over {TP + FP}}$$
We will demonstrate this with an example.
| Predicted classes | |||
|---|---|---|---|
| spam | ham | ||
| Actual classes |
spam | 12 | 14 |
| ham | 0 | 114 | |
We can calculate the precision for our example:
TP = 114
FP = 14
# FN (0) and TN (12) are not needed in the formuala!
precision = TP / (TP + FP)
print(f"precision: {precision:4.2f}")
OUTPUT:
precision: 0.89
Exercise: Before you go on with the text think about what the value precision means. If you look at the precision measure of our spam filter example, what does it tell you about the quality of the spam filter? What do the results of the confusion matrix of an ideal spam filter look like? What is worse, high FP or FN values?
You will find the answers indirectly in the following explanations.
Incidentally, the ideal spam filter would have 0 values for both FP and FN.
The previous result means that 11 mailpieces out of a hundred will be classified as ham, even though they are spam. 89 are correctly classified as ham. This is a point where we should talk about the costs of misclassification. It is troublesome when a spam mail is not recognized as "spam" and is instead presented to us as "ham". If the percentage is not too high, it is annoying but not a disaster. In contrast, when a non-spam message is wrongly labeled as spam, the email will not be shown in many cases or even automatically deleted. For example, this carries a high risk of losing customers and friends. The measure precision makes no statement about this last-mentioned problem class. What about other measures?
We will have a look at recall and F1-score.
Recall
Recall, also known as sensitivity, is the ratio of the correctly identified positive cases to all the actual positive cases, which is the sum of the "False Negatives" and "True Positives".
$$ recall = {TP \over {TP + FN}}$$
TP = 114
FN = 0
# FT (14) and TN (12) are not needed in the formuala!
recall = TP / (TP + FN)
print(f"recall: {recall:4.2f}")
OUTPUT:
recall: 1.00
The value 1 means that no non-spam message is wrongly labeled as spam. It is important for a good spam filter that this value should be 1. We have previously discussed this already.
Live Python training
Enjoying this page? We offer live Python training courses covering the content of this site.
See our Python training courses
F1-score
The last measure, we will examine, is the F1-score.
$$ F_1 = {2 \over {{1 \over recall} + {1 \over precision}}} = 2 \cdot {{{precision}\cdot{recall}} \over {{precision} + {recall}} }$$
TF = 7 # we set the True false values to 5 %
print("  FN    FP   TP     pre   acc   rec   f1")
for FN in range(0, 7):
    for FP in range(0, FN+1):
        # the sum of FN, FP, TF and TP will be 100:
        TP = 100 - FN - FP - TF
        #print(FN, FP, TP, FN+FP+TP+TF)
        precision = TP / (TP + FP)
        accuracy = (TP + TN)/(TP + TN + FP + FN)
        recall = TP / (TP + FN)
        f1_score = 2 * precision * recall / (precision + recall)
        print(f"{FN:6.2f}{FP:6.2f}{TP:6.2f}", end="")
        print(f"{precision:6.2f}{accuracy:6.2f}{recall:6.2f}{f1_score:6.2f}")
OUTPUT:
  FN    FP   TP     pre   acc   rec   f1
  0.00  0.00 93.00  1.00  1.00  1.00  1.00
  1.00  0.00 92.00  1.00  0.99  0.99  0.99
  1.00  1.00 91.00  0.99  0.99  0.99  0.99
  2.00  0.00 91.00  1.00  0.99  0.98  0.99
  2.00  1.00 90.00  0.99  0.98  0.98  0.98
  2.00  2.00 89.00  0.98  0.98  0.98  0.98
  3.00  0.00 90.00  1.00  0.98  0.97  0.98
  3.00  1.00 89.00  0.99  0.98  0.97  0.98
  3.00  2.00 88.00  0.98  0.97  0.97  0.97
  3.00  3.00 87.00  0.97  0.97  0.97  0.97
  4.00  0.00 89.00  1.00  0.98  0.96  0.98
  4.00  1.00 88.00  0.99  0.97  0.96  0.97
  4.00  2.00 87.00  0.98  0.97  0.96  0.97
  4.00  3.00 86.00  0.97  0.96  0.96  0.96
  4.00  4.00 85.00  0.96  0.96  0.96  0.96
  5.00  0.00 88.00  1.00  0.97  0.95  0.97
  5.00  1.00 87.00  0.99  0.97  0.95  0.97
  5.00  2.00 86.00  0.98  0.96  0.95  0.96
  5.00  3.00 85.00  0.97  0.96  0.94  0.96
  5.00  4.00 84.00  0.95  0.95  0.94  0.95
  5.00  5.00 83.00  0.94  0.95  0.94  0.94
  6.00  0.00 87.00  1.00  0.97  0.94  0.97
  6.00  1.00 86.00  0.99  0.96  0.93  0.96
  6.00  2.00 85.00  0.98  0.96  0.93  0.96
  6.00  3.00 84.00  0.97  0.95  0.93  0.95
  6.00  4.00 83.00  0.95  0.95  0.93  0.94
  6.00  5.00 82.00  0.94  0.94  0.93  0.94
  6.00  6.00 81.00  0.93  0.94  0.93  0.93
We can see that f1-score best reflects the worse case scenario that the FN value is rising, i.e. ham is getting classified as spam!
Live Python training
Enjoying this page? We offer live Python training courses covering the content of this site.
Upcoming online Courses
See our Python training courses